
Use the Cross-Sell Map
This article is for Crush users who already have an Account Plan. When you finish, a Cross-Sell Map shows where you sell today, where a competitor sits, and where there is room to grow.
Relationship Map-only customers do not have Cross-Sell. This page is Crush-only.
What the grid is
A Cross-Sell Map is a matrix on the Account Plan.
- Rows are usually products, services, or solutions.
- Columns are usually slices of the account (business units, regions, brands). Your org chooses the pairing. Prolifiq does not ship a required product catalog.
Each cell can hold amount types, data types, and highlights. The grid also feeds the Account Plan Score. An empty grid is a low completeness component, not a “bad account.”
Create or open a Cross-Sell Map
- Open the Account Plan.
- Open the Cross-Sell section on the plan.
- If none exists, Create New Cross-Sell Map and choose:
- Free Form — you add the rows and columns yourself, and type values into cells. See Use a freeform Cross-Sell Map.
- From Template — rows, columns, and cell values come from a Cross-Sell Template your admin prepared. See Use a template-based Cross-Sell Map.
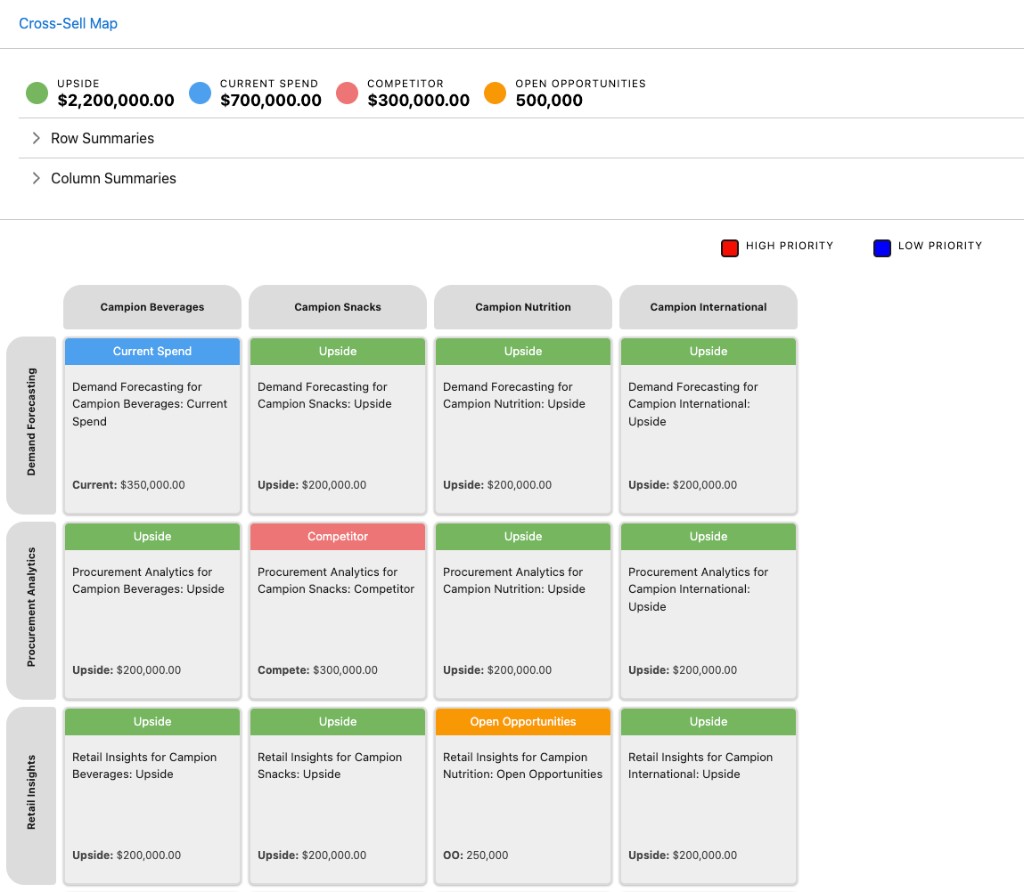
Pick the mode that matches how the org wants to work. You cannot switch a saved map from freeform to template (or the other way) after you create it. Create a new map if you chose the wrong option.
Freeform vs template
| Freeform | Template | |
|---|---|---|
| Rows and columns | You add and edit them (Edit Rows & Columns) | Fixed by the template |
| What appears in a cell | A tile (node) you add and fill in | A summary of mapped Salesforce records |
| Amount values | Typed in by hand | Pulled from Salesforce with the template’s filters |
| Data type colors | Values show in the cell detail panel | Option color also paints a chip in the cell |
| Edit an opportunity from the map | No — there is no linked opportunity on the cell | Yes — open and edit the mapped record from the cell panel |
| Notes on the cell | Stored on the cell | Same, plus a yellow notes mark on the cell when notes exist |
Both modes support highlights, data types, amount types, and summary formulas. The visuals and the source of the numbers differ.